
Ask which positions the number represents
Evens and colleagues reported cavity measurements and array-level summaries. On a supplier report, start with the denominator. Six readings could mean six positions on one array, the same position on six arrays, or repeated readings of one feature. Ask for the array identifier and position alongside each value. The three arrangements answer different questions about variation, even when the reported number of readings and the average happen to match.
Evens et al. (2022) · Cavity inspection and feature uniformity in molded arrays
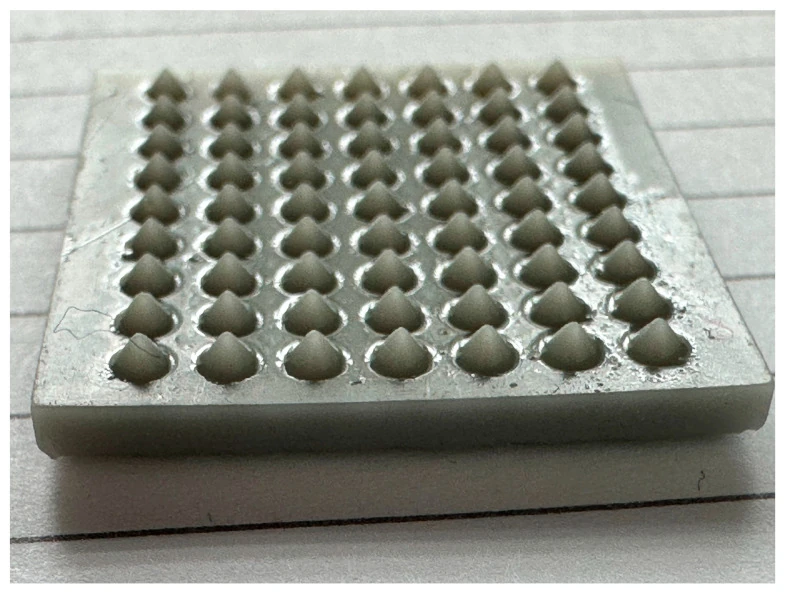
Image credits
Faisal Khaled Aldawood, Abhay Andar and Salil Desai · Image source · CC BY 4.0 · Original figure proportions and markings retained; converted to WebP.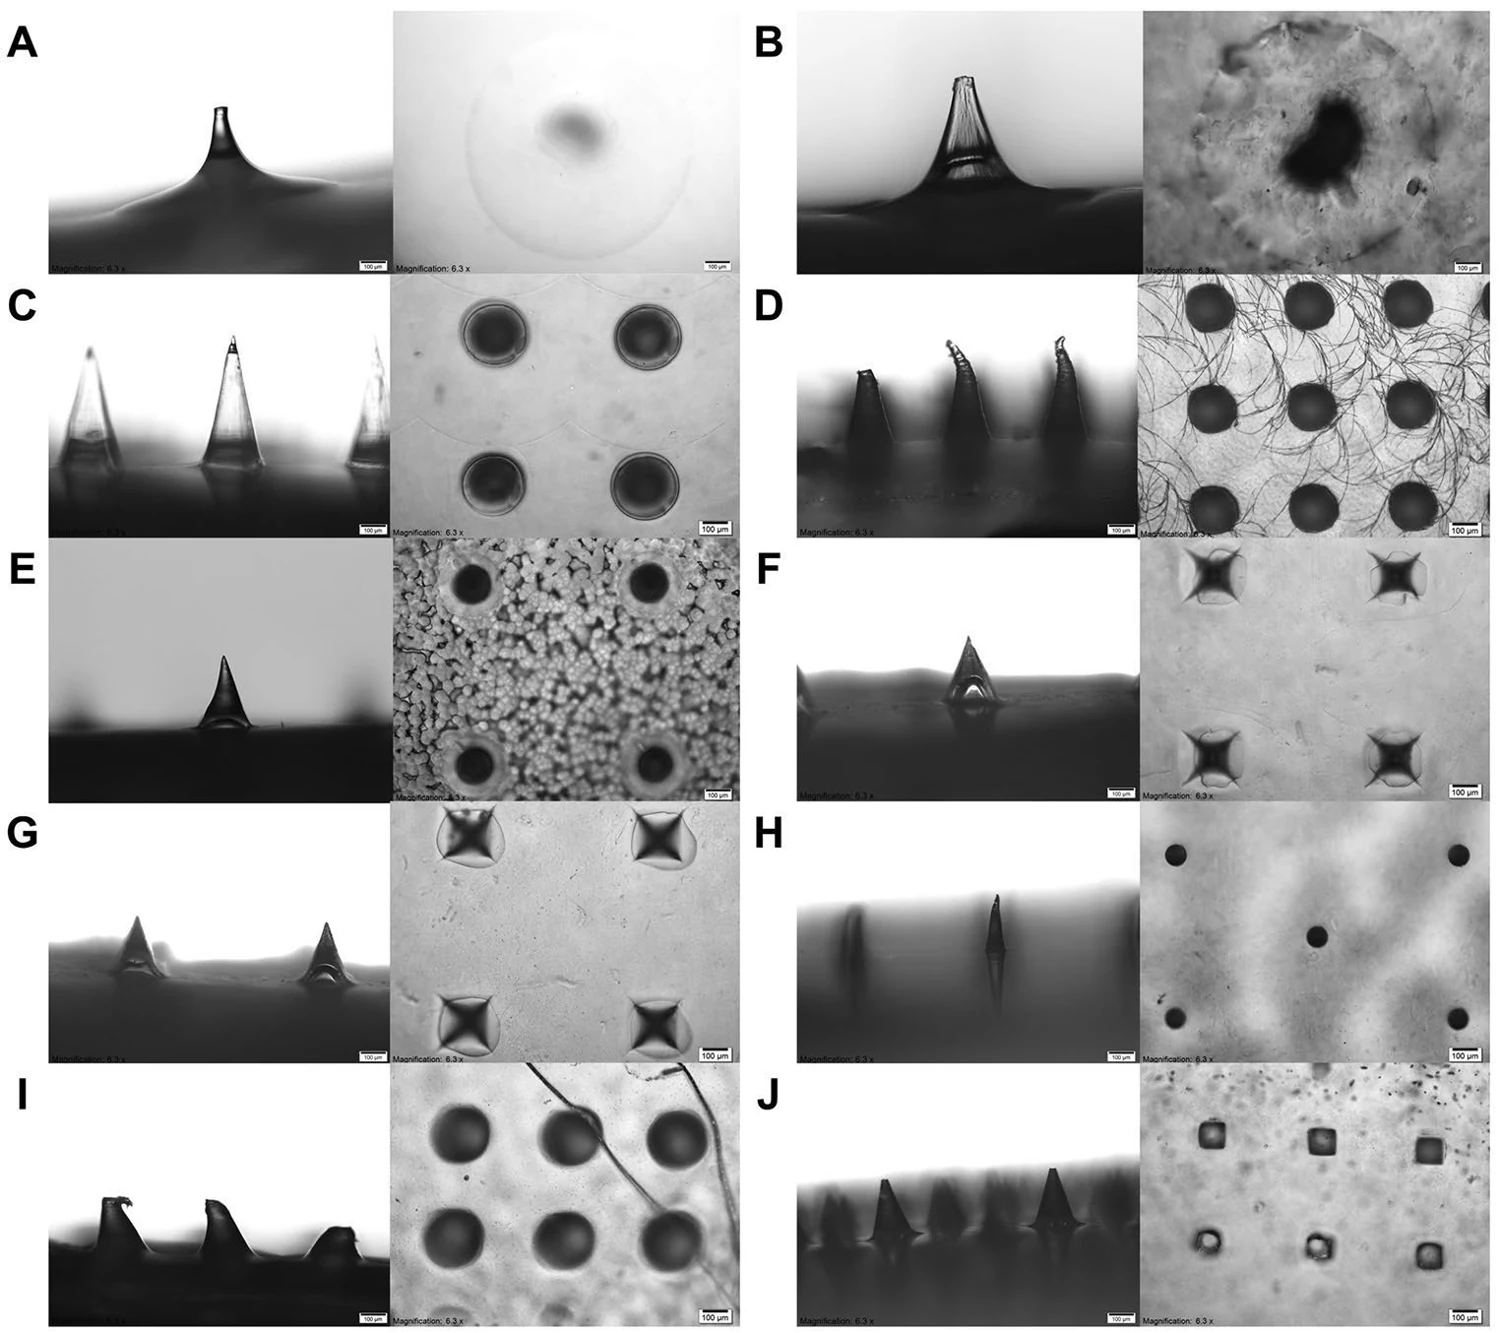
Image credits
Jing Yi Lee, Shi Hui Dong, Keng Wooi Ng and Choon Fu Goh · Image source · CC BY 4.0 · Original figure proportions and markings retained; converted to WebP.Keep edge and center observations visible
Draw a simple outline and mark each measured position. If an example supplier report contains four corners and one central position, five marks should appear on the map. An unmarked middle row is an unmeasured area. Keep its status visible when sharing the report. La Malfa and colleagues’ use of positional references illustrates how an identifiable field can be located again if a later inspection adds more readings.
La Malfa et al. (2025) · Reference features and coded arrays in mold replication
Use comparable groups for a repeat shipment
For a reorder, ask whether both reports cover corresponding positions and the same number of physical arrays. A pooled average from several units is hard to compare with a single carefully chosen photograph. Request a separate line for each matched position, and record missing measurements explicitly. Gülçür and colleagues assessed replication across trials. In procurement, preserving the run and unit identifiers allows the reviewer to distinguish changes between shipments from differences in sampling.
Gülçür et al. (2023) · Characterising replication across molding trials
Prepare your inquiry
A useful sampling report retains the position, array and shipment behind each measurement.